Heavy tails, fitted and checked.
Heavy-tail PDF and CCDF fits, Xmin diagnostics, histogram and density-map fits, one click from the Layers box and checked against golden-master results.

Unify data analysis, plotting, and publishing in one workspace.
Take raw data files to publication-ready figures in one native Mac app: import, analyze, fit, plot and export, with an assistant that can drive every feature.
Apple silicon · macOS 15 or later · Free plan · Plus free for 30 days
Send to my MacAutoplot runs on a Mac. Send the link to yourself, or open it in the Mac App Store.
Analysis at the centre, with everything from the raw file to the paper around it.
Heavy-tail PDF and CCDF fits, Xmin diagnostics, histogram and density-map fits, one click from the Layers box and checked against golden-master results.
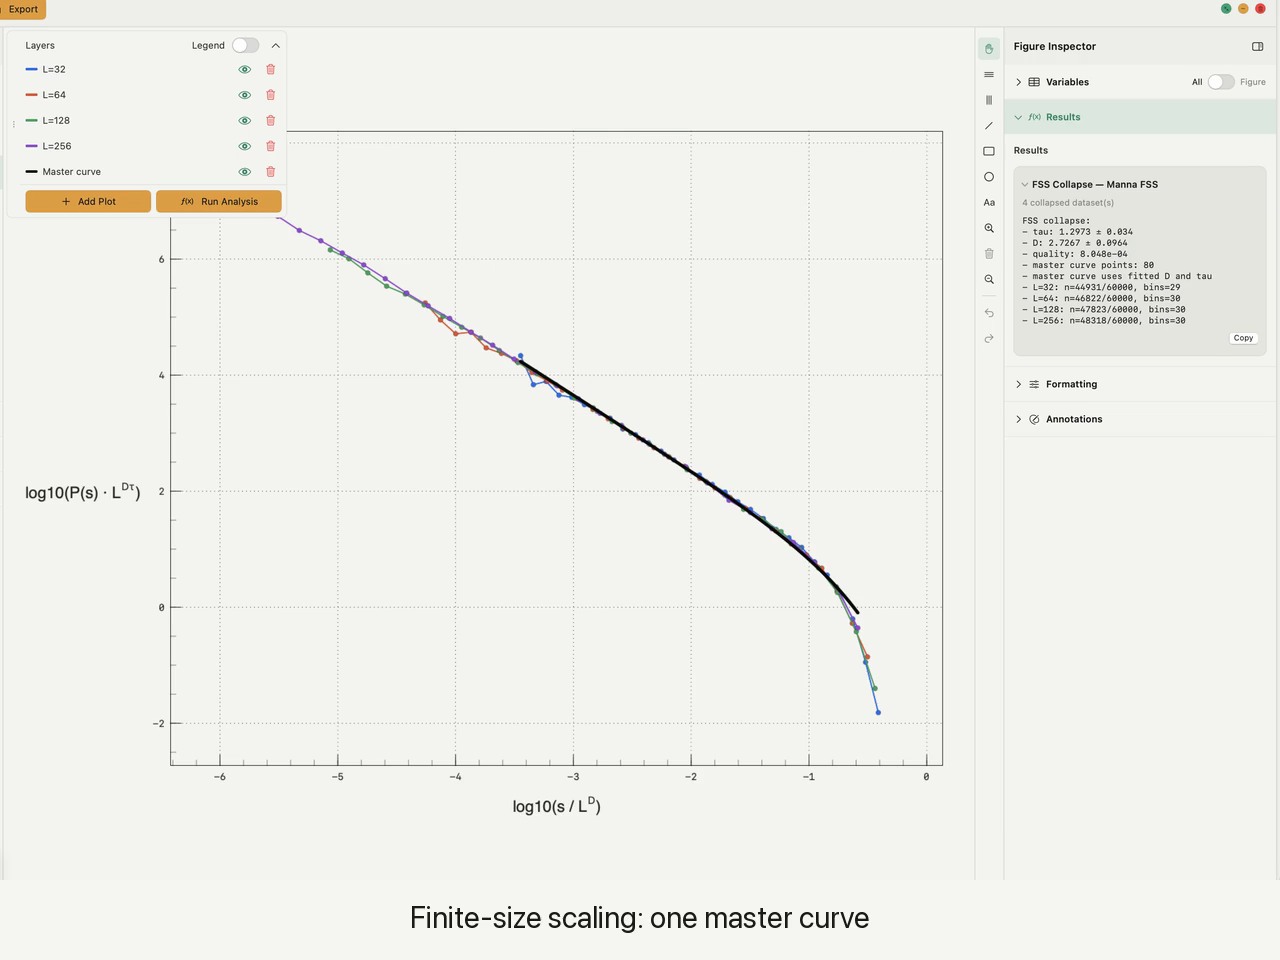
Automated finite-size scaling finds τ and D with their errors, and scaling relations x ∼ yᵅ fit a raw cloud and its log-binned means.
It runs on your Mac, inside a working folder. With cloud models, only column names leave it.
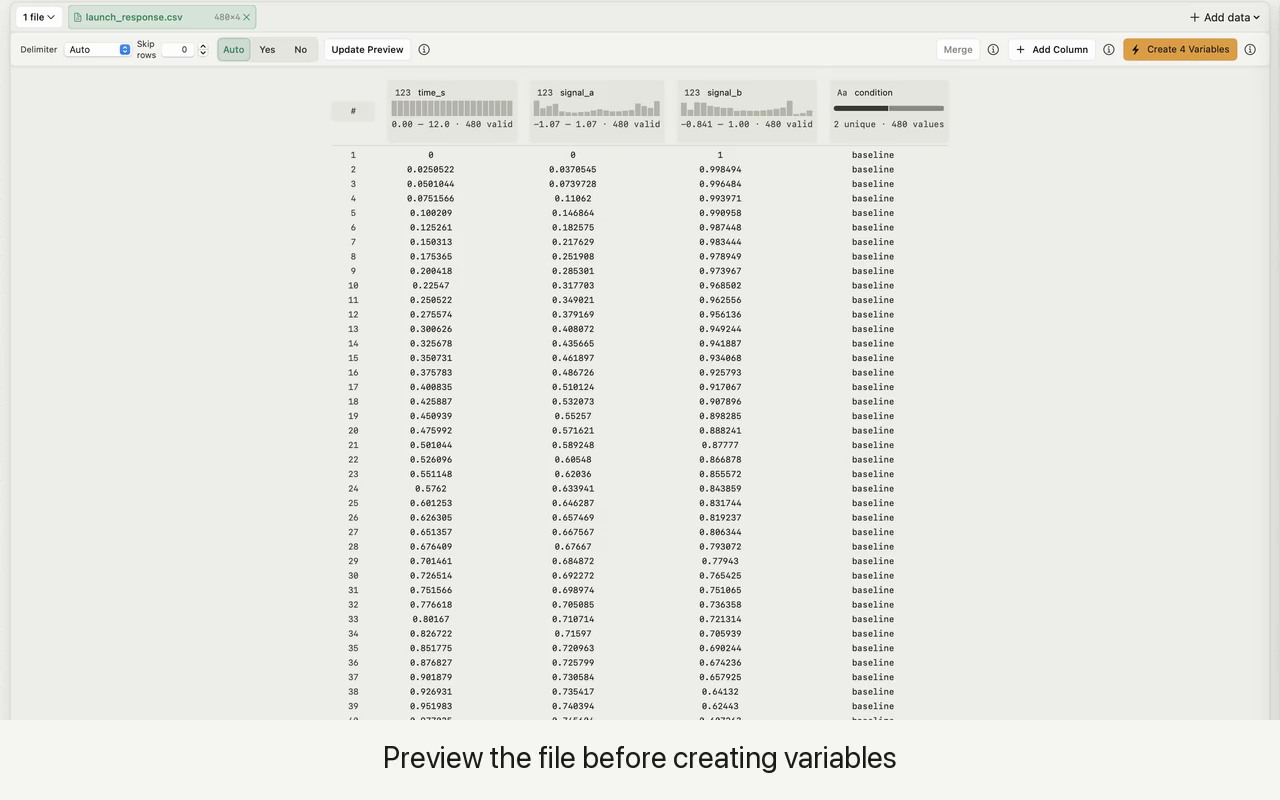
Local files or SFTP, merged into one project, with headers and delimiters handled out of the box. Need to filter, split or summarize files first? Ask the assistant.
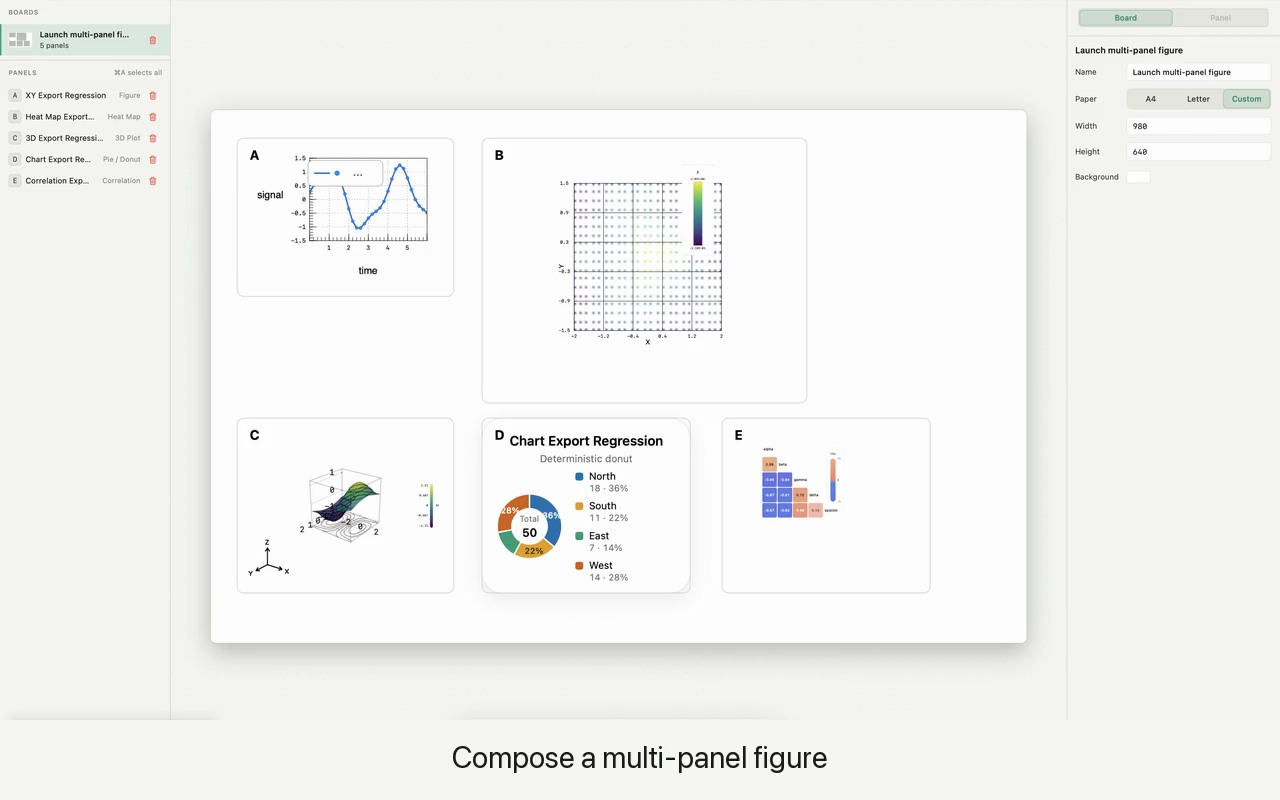
Journal presets and DPI, pixel-perfect annotations, every colour and font editable.
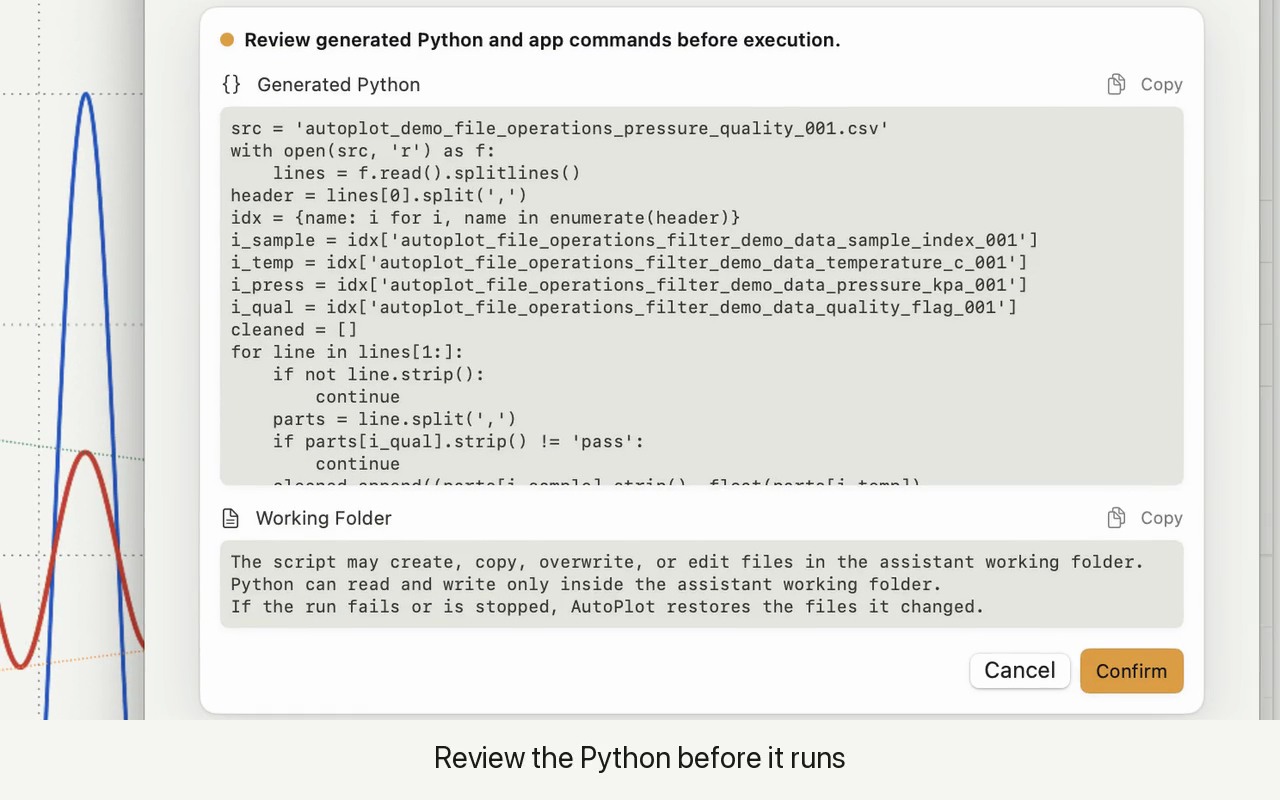
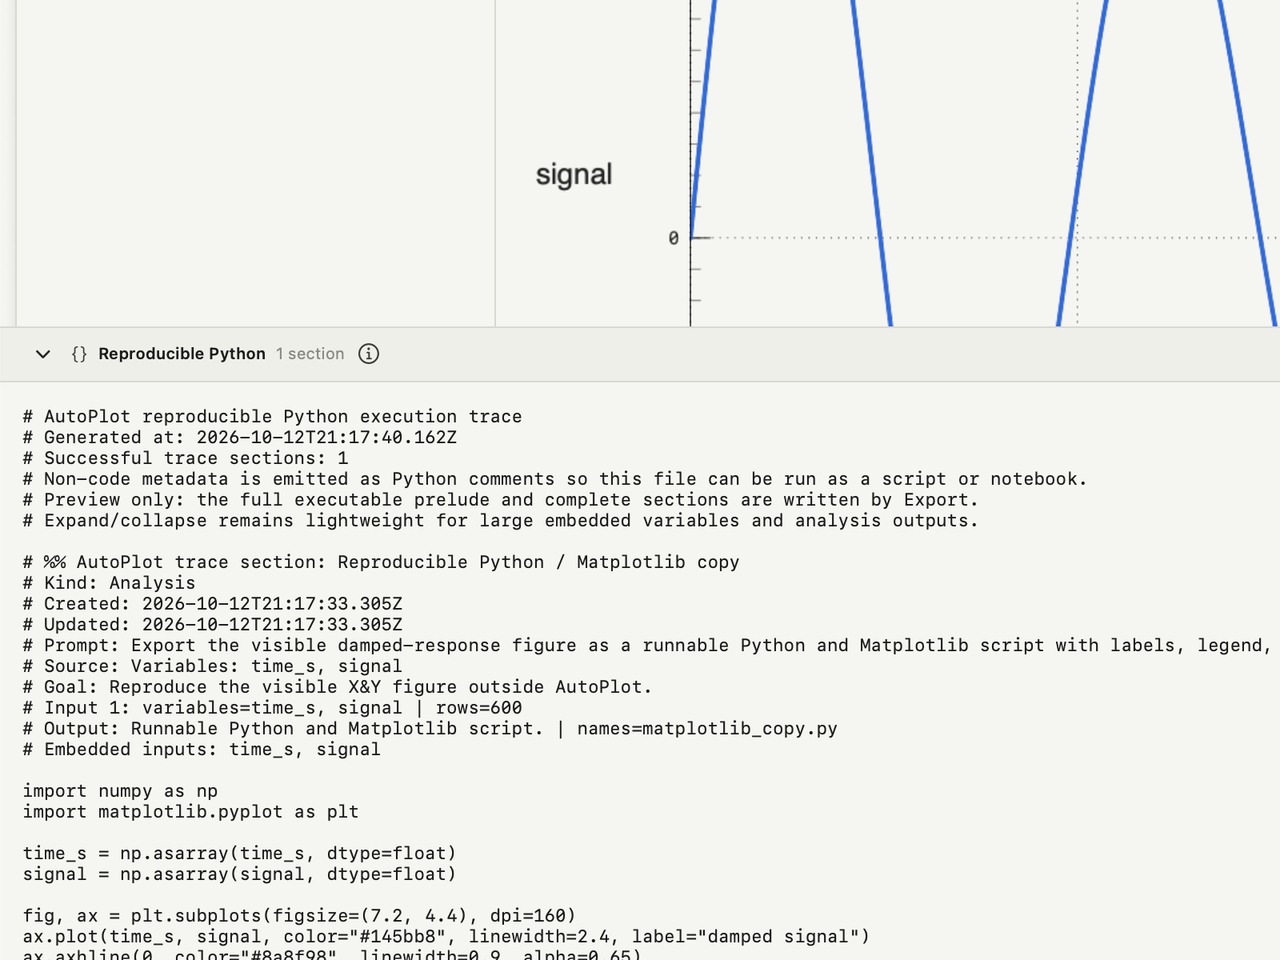
Export the exact Python that ran, next to the result.
Hand it to a collaborator or a reviewer as it is.
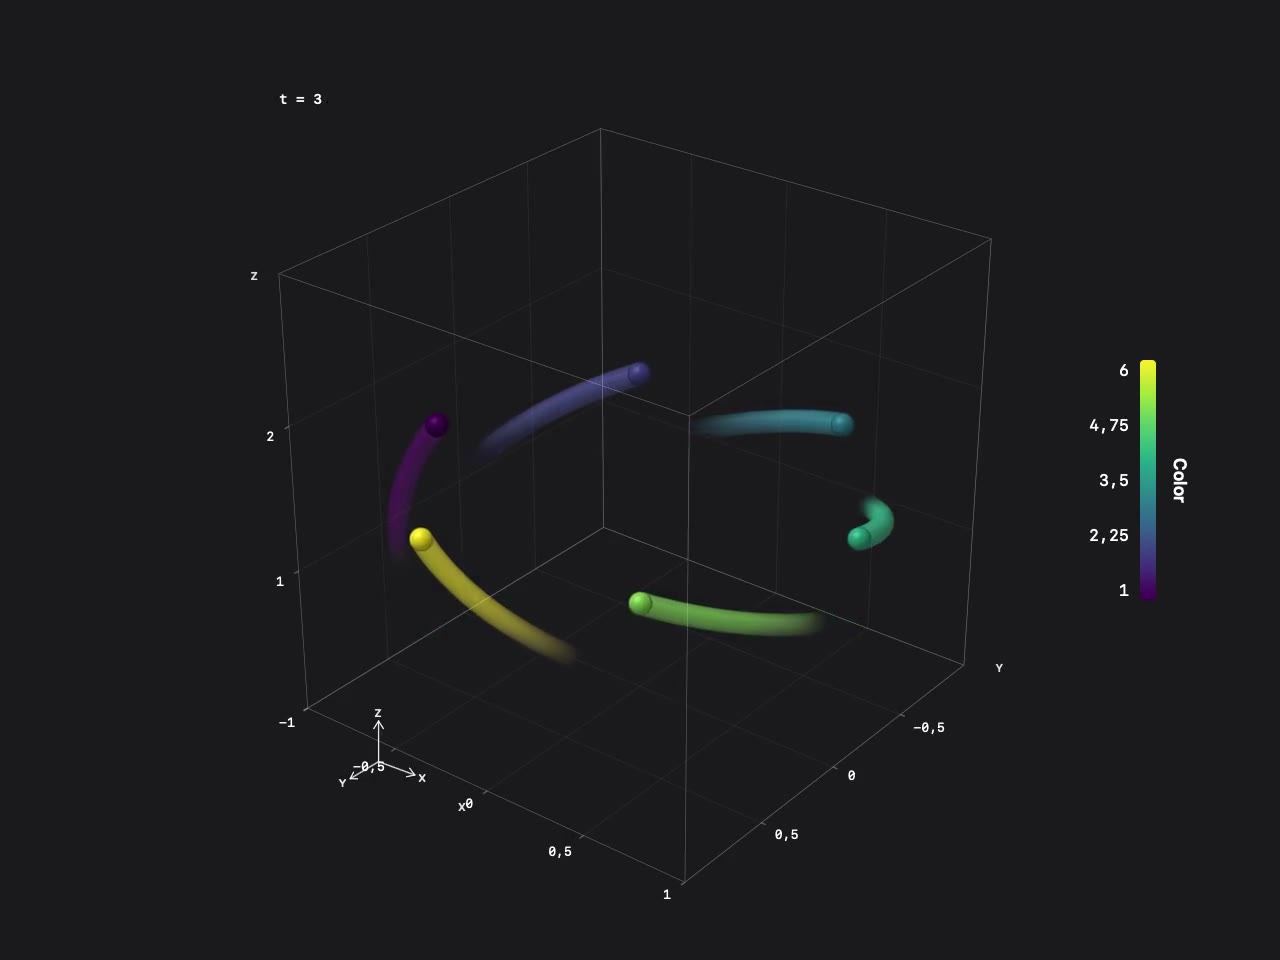
3D scatter and trajectory plots draw up to 500,000 points, and live animations stay interactive.
Every method runs a golden-master-tested implementation on your Mac. Most write their results back as variables you can re-plot, fit again or export; histogram fits export one reusable fit function.
Fit heavy tails and read the exponent, prefactor and R².
Log-binned least squares; A·x^−ε·e^−λx via SciPy
Inspect tails without binning, in log-log space.
Empirical P(X ≥ x); Python powerlaw library
Choose where the tail starts, with the D-versus-candidate curve to show for it.
Kolmogorov–Smirnov distance scan over candidate cutoffs
Collapse distributions across system sizes and get τ and D with uncertainties.
Grid search over τ and D minimising the collapse residual
Fit power-law relations between two variables and read the exponent.
Optional log binning; regression in log-log space
Read broad positive distributions clearly on log-log axes.
Logarithmic bins, geometric-mean centres, density-normalised
Fit binned data with Gaussian mixtures or your own model, with parameter errors and R², and export the fit as a reusable function.
Nonlinear least squares: 1–3 Gaussian components or a custom formula
Measure the area over a chosen x-range, signed or clamped.
Baseline-subtracted trapezoidal integration
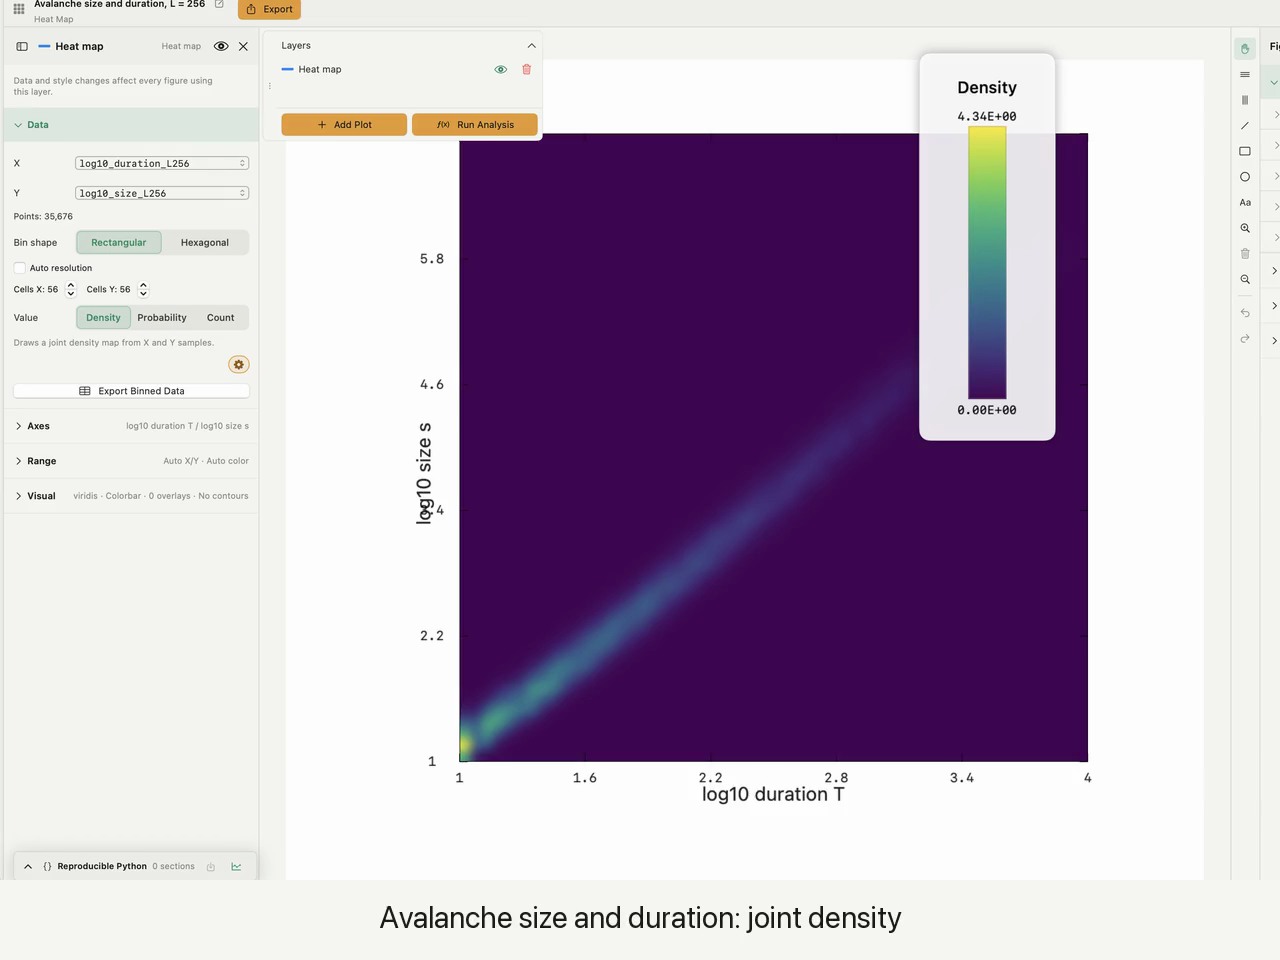
Turn point clouds into density maps and fit them.
Joint density binning; Gaussian or custom 2D fit
Fit surfaces on heat maps and save the fitted Z as a variable.
Gaussian or custom z = f(x, y) on heat maps
Smoothing, a transform, a filter that isn't listed? Ask the assistant: it writes the Python, runs it on your Mac and keeps the script.
The assistant can drive every Autoplot feature, from import to export. Describe the result and it builds it.
| Plans | Free$0forever | Plus 30 days free$7.99per month · $79.99 a year | Pro$17.99per month · $179.99 a year |
|---|---|---|---|
| Plots | |||
| X & Y plots | Included | Included | Included |
| Histograms — Gaussian & mixture fits | Included | Included | Included |
| Heat maps with 2D fits | Not included | Included | Included |
| 3D plots | Not included | Included | Included |
| Correlation matrices | Not included | Included | Included |
| Categorical charts | Not included | Included | Included |
| Compose | Not included | Included | Included |
| Analysis | |||
| PDF / log-binned distributions | Included | Included | Included |
| Power-law analysis | Included | Included | Included |
| CCDF tail fit | Not included | Included | Included |
| x_min diagnostics | Not included | Included | Included |
| Finite-size-scaling collapse | Not included | Included | Included |
| Scaling relations (x ∼ yᵅ) | Not included | Included | Included |
| Export & projects | |||
| PNG & JPEG export | Included | Included | Included |
| Vector PDF export | Not included | Included | Included |
| Project save / load | Included | Included | Included |
| Assistant | |||
| Hosted-AI credits / month | 10 | 10 | 1,000 |
| Choose a plan inside the app. Yearly billing is two months free. | Download freeSend to my Mac | Try Plus freeSend to my Mac | Download freeSend to my Mac |
| Getting started | |
|---|---|
| Which Macs does it run on? | Any Apple silicon Mac (M1 or later) running macOS 15 Sequoia or later. |
| Where do I get it? | Download it directly from this site, or from the Mac App Store. |
| Does it work offline? | Yes. The full local toolkit works without a network connection. Only the hosted assistant, your account and billing need one. |
| Your data | |
| Does my raw data leave my Mac? | No. Import, analysis, plotting and export run locally. With cloud models, the assistant receives your request and column names, not the values. |
| Is my data used to train AI models? | No. Your raw data never reaches the AI layer. |
| Can the assistant run entirely on my Mac? | Not yet. Fully on-device models are coming soon. |
| Pricing | |
| Is Free a trial? | No. Free is permanent. Every Plus feature is also free for your first 30 days. |
| Plus or Pro? | Plus opens every plot type and analysis. Pro adds 1,000 assistant credits a month for heavy assistant use. |
| Switching | |
| I use Igor, Origin or Prism. Should I switch? | Autoplot isn't feature-for-feature with Igor, Origin or Prism. Most people keep the tool they know for its specialities and move the plotting, fitting and figure work they repeat. |
| Can I take my work to Python? | Yes. Export the exact Python that ran, or any figure as an editable Matplotlib script. |
Apple silicon · macOS 15 or later · Free plan · Plus free for 30 days
Send to my MacAutoplot runs on a Mac. Send the link to yourself, or open it in the Mac App Store.